Creators
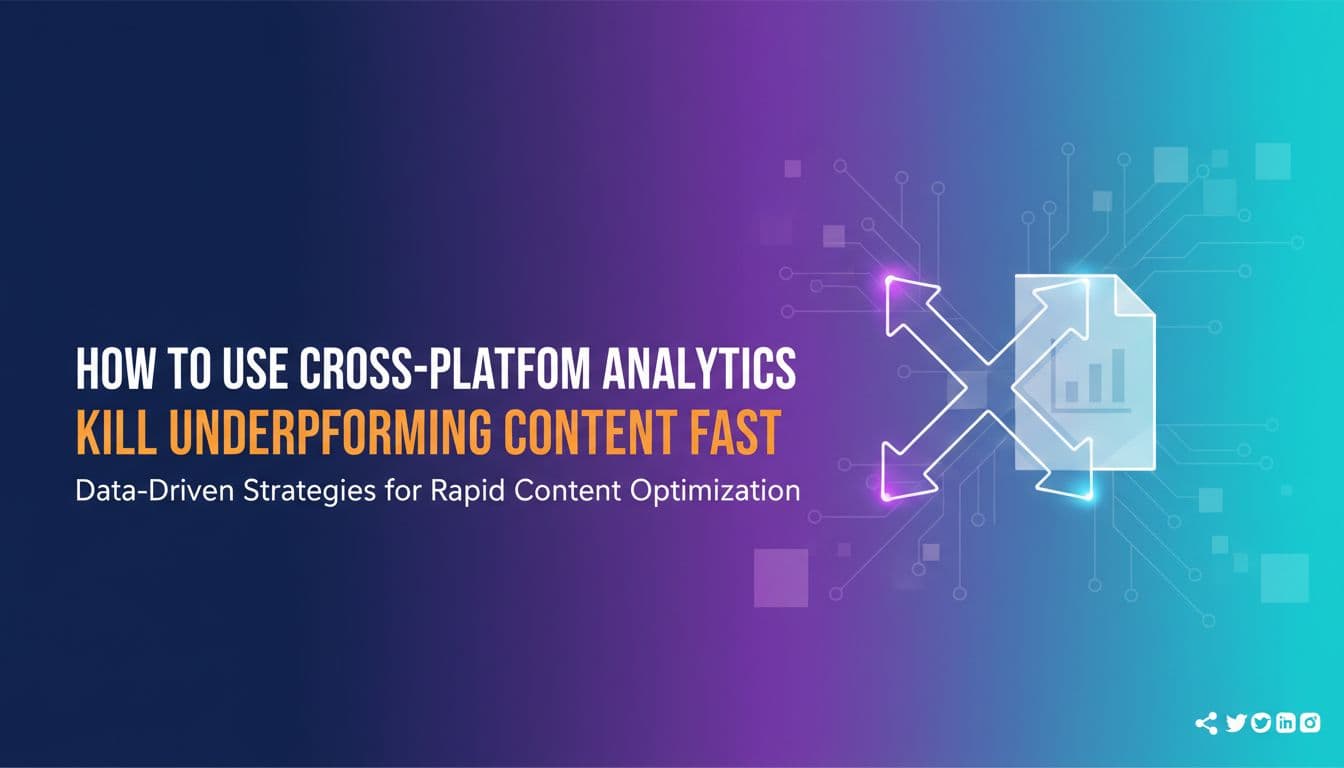
How to Use Cross-Platform Analytics to Kill Underperforming Content Fast
Most marketing teams and solopreneurs post content, check a few numbers, and move on. But without a clear view across every platform, you're flying blind. You might be pouring time and budget into posts that nobody cares about while your best-performing content goes unnoticed on a channel you barely check. Cross-platform analytics changes that. It gives you a unified picture of what's working, what's dead weight, and where to focus next. This guide breaks down how to spot underperforming content fast, make smarter kill-or-keep decisions, and redirect your energy toward content that actually drives results. Whether you manage one brand or ten, the teams that win in 2026 are the ones who move quickly on data, not gut feeling.

By Wilzer Jean-Baptiste
Published 11 min read
You've been posting consistently. You're showing up on Instagram, LinkedIn, TikTok, maybe YouTube. You've got a content calendar, a scheduling tool, and a process. But here's the thing: consistent posting and smart posting are not the same thing. If you're not tracking performance across every platform in one place, you're almost certainly spending real time and money on content that's quietly going nowhere. And you probably don't know which posts those are.
The Hidden Cost of Posting Without a Full Picture
You're Probably Wasting 30-40% of Your Content Budget
Here's a number that should bother you. Research consistently shows that brands waste somewhere between 30 and 40 percent of their content budget on posts that generate almost no meaningful engagement. That's not a rounding error. That's a real chunk of your time, your money, and your team's energy going straight into the void.
The problem isn't that the content is always bad. Sometimes it's decent content posted at the wrong time, on the wrong platform, to an audience that was never going to care. But without cross-platform social media analytics, you never know which posts are the culprits. You just keep publishing, keep hoping, and keep bleeding budget on dead weight.
Cross-platform analytics flips the script. Instead of guessing, you see exactly which posts drove clicks, shares, saves, and conversions, and which ones got ignored. You stop throwing resources at content that doesn't work and start doubling down on what does. The brands that track this stuff consistently aren't just better at reporting. They're better at spending.
Think about what 30 percent of your monthly content budget actually looks like. For a small business spending 10 hours a week on social media, that's three hours a week wasted. For an agency managing five clients, it's worse. Cross-platform content performance analytics gives you the data to cut that waste fast and redirect it toward content that moves the needle.
Single-Platform Dashboards Hide the Real Story
If you're only looking at Instagram insights or LinkedIn analytics in isolation, you're missing half the picture. A post that flops on Instagram might crush it on LinkedIn. A short-form video that gets zero traction on TikTok might perform well on YouTube Shorts. Platform-specific dashboards don't show you that. They only show you what happened in their corner of the world.
Multi-platform analytics pulls everything into one view so you can actually compare. You see where your audience pays attention, what format they respond to on each channel, and which platforms are worth your continued investment. This isn't just a reporting upgrade. It's a strategy upgrade. When you know that your audience on LinkedIn engages heavily with long-form thought leadership but scrolls past your quick tips on Instagram, you stop wasting effort on the wrong format for the wrong crowd.
The format insight is especially valuable. Video might outperform static images on one platform while the opposite is true somewhere else. Without a unified content performance dashboard, you'd never catch that pattern. You'd just keep posting the same mix everywhere and wondering why results are inconsistent.
Why Most Teams Never Fix the Problem
The honest answer is that fixing this requires looking at data across multiple platforms at once, and most tools don't make that easy. Marketers end up exporting CSVs from four different dashboards, building their own spreadsheets, and spending hours trying to make sense of metrics that aren't even defined the same way across platforms. By the time they figure out what's underperforming, two weeks have passed and the damage is done. The solution isn't working harder on analysis. It's having a system that surfaces the signal automatically so you can act before the window closes.
Speed Is the Real Competitive Advantage
The 48-72 Hour Rule for Underperforming Content
Speed matters more than most teams realize. The longer underperforming content stays live, the more it drags down your overall reach and algorithm performance. Social media algorithms on every major platform use early engagement signals to decide how broadly to distribute your content. If a post gets weak engagement in the first few hours, the algorithm pulls back on distribution. The post reaches fewer people, gets even less engagement, and the cycle compounds.
Teams that identify and act on underperforming content within 48 to 72 hours recover faster. They can pull the post, rework the angle, redistribute the budget, or simply move on and post something better. The ones who wait a week to check their numbers are already behind. By then, the algorithm has made its decision, the audience has moved on, and the opportunity cost has stacked up.
This is why cross-platform analytics isn't just a reporting tool. It's a speed tool. When you can see at a glance which posts are underperforming across all your channels, you make faster decisions. You don't need to dig. You just act. That 48-hour window is the difference between a bad post that costs you a little and a bad post that quietly tanks your reach for the next two weeks.
Kill-or-Keep Decisions in Real Time
The best content teams treat their content calendar like a living document, not a set-it-and-forget-it schedule. They check performance early, make a call, and move on. That call is simple: kill it or keep it. If a post is underperforming against your baseline metrics within the first 48 hours, you kill it or replace it. If it's trending up, you keep it and consider amplifying it.
Making this decision in real time requires two things. First, you need a clear baseline. What does a normal post look like for your account on each platform? What's your average engagement rate on Instagram? What's a typical click-through on LinkedIn? Without a baseline, you can't know if a post is actually underperforming or just slower to warm up. Second, you need the data in front of you without having to go hunting for it. A multi-platform analytics dashboard that surfaces performance automatically means you spend your time deciding, not digging.
Redirecting Effort to Winners
Killing underperforming content is only half the equation. The other half is redirecting that freed-up effort toward what's actually working. When you spot a post that's outperforming your baseline, that's a signal. What was the format? What was the topic? What platform was it on? What time did it go live? Those answers tell you what to make more of.
Smart teams use cross-platform data not just to cut waste but to build a feedback loop. Every piece of content teaches you something. The analytics just make sure you're actually learning the lesson instead of repeating the same mistakes on a new week's schedule. When your content calendar reflects what your data is telling you, results compound over time instead of staying flat.
Understanding What the Metrics Are Actually Telling You
Why Platform Metrics Don't Mean the Same Thing
Metrics vary wildly by platform, and comparing them without context is one of the most common mistakes in social media management. An engagement rate of 3 percent on LinkedIn is strong. The same rate on TikTok might mean your content is struggling. A high reach number on Facebook doesn't tell you much if nobody clicked or saved anything. Click-through rate matters more for LinkedIn articles than for Instagram Reels. Conversion tracking on YouTube looks completely different from conversion tracking on X.
This is why a unified view matters so much. You need a content performance dashboard that translates platform-specific data into one clear signal: is this working or not? Not raw numbers that require context you don't have memorized. Not vanity metrics that look impressive but don't connect to business outcomes. A clear, comparable signal that tells you whether a piece of content is worth your continued investment across every channel you manage.
Aidelly's cross-platform analytics dashboard does exactly this. It tracks engagement, reach, clicks, and conversions across all connected channels and surfaces the data in a single view so you're not toggling between six different native dashboards trying to make sense of incompatible numbers.

The Metrics That Actually Matter for Content Decisions
Not every metric deserves equal weight when you're making kill-or-keep decisions. Engagement rate tells you whether your audience found the content interesting enough to interact with. Reach tells you how many people the algorithm pushed it to. Click-through rate tells you whether the content motivated action. Saves and shares tell you whether people found it valuable enough to keep or pass along. Conversion tells you whether it drove a real business outcome.
For most content decisions, engagement rate and click-through rate are your most reliable early signals. If engagement is low in the first 24 hours, the algorithm won't push the post further. If click-through is low on a post designed to drive traffic, the call to action or the creative isn't landing. These two metrics give you the fastest read on whether a post is working before you've invested more time or budget promoting it.
Building a Baseline That Makes Comparisons Meaningful
The only way to know if a post is underperforming is to know what normal looks like for your account. That means tracking your average engagement rate, reach, and click-through over time on each platform. Once you have a baseline, every new post has a benchmark to measure against. A post that hits 150 percent of your average engagement rate is a winner worth studying. A post that hits 40 percent is dead weight worth cutting.
Without a baseline, you're just reacting to raw numbers that don't mean anything without context. Multi-channel social media management tools that track historical performance make this easy because the baseline builds itself over time. You stop second-guessing whether a post is actually underperforming and start making decisions based on what your own data tells you.
How AI-Powered Insights Replace Hours of Manual Analysis
The Problem With Spreadsheet Analysis
Manual analysis is slow, error-prone, and expensive. A marketing team that spends four hours a week pulling data from platform dashboards, cleaning it, and building reports is spending roughly 200 hours a year on analysis alone. That's five full work weeks. For a solopreneur, it's even worse because those hours come directly out of time that could go toward creating content, building relationships, or growing the business.
Spreadsheet analysis also has a lag problem. By the time you've pulled the data, formatted it, and spotted the pattern, the window to act has often closed. The post that needed to be killed 48 hours ago is still live. The winning content that deserved more promotion has already peaked. Manual analysis tells you what happened. AI-powered insights tell you what's happening right now and what to do about it. That difference in timing is where competitive advantage actually lives.
What AI-Powered Insights Actually Surface
AI-powered insights beat manual analysis because they don't just show you the numbers. They surface patterns you wouldn't catch on your own. Which content formats consistently outperform on each platform. Which posting times correlate with higher engagement for your audience. Which topics generate clicks versus saves versus shares. Which combinations of format, topic, and timing drive the most conversions.
These patterns exist in your data whether or not you find them. Manual analysis might catch the obvious ones. AI catches the subtle ones, the ones that only show up when you look across hundreds of posts over months of data. Aidelly's AI-powered insights surface this automatically. Instead of spending hours digging through spreadsheets, you get the signal handed to you. You see what's working, why it's working, and what to post next without the guesswork. That's a fundamentally different way of running a content strategy.
From Insights to Action Without the Bottleneck
The real value of automated insights isn't just knowing what's working. It's being able to act on it immediately. When an AI insight tells you that your carousel posts on LinkedIn are outperforming everything else by 60 percent, you don't need to schedule a meeting to discuss it. You open your content calendar, shift more carousel posts into the next two weeks, and move on. The insight feeds directly into the schedule.
This is where the loop closes. The analytics surface what's working. The AI content drafting helps you create more of it. The visual content calendar lets you plan it. The scheduling tool pushes it live at the right time. The whole workflow runs in one place, which means the time between insight and action shrinks from days to minutes. That speed is the edge that separates teams who grow consistently from teams who stay stuck guessing what to post next.
Cross-platform analytics isn't about having more data. It's about making faster, smarter decisions with the data you already have. You stop wasting 30 to 40 percent of your content budget on posts nobody cares about. You catch underperforming content in the first 48 hours before it drags down your reach. You understand what metrics matter on each platform and what they're actually telling you. And you let AI surface the patterns so you spend your time acting on insights instead of hunting for them. The right social media management tools make all of this possible without adding hours to your week. When your analytics, scheduling, and content creation live in one place, the feedback loop between data and action gets tight enough to actually change your results.
If you want a low-lift way to apply these ideas, Aidelly helps you keep your social content consistent without extra busywork.The real win isn't just spotting underperforming content—it's having a system that lets you move fast enough to actually do something about it. With multi-platform publishing, you schedule smarter across all your channels, test what works, and kill what doesn't before it drains your budget. Ready to stop wasting 30-40% of your content effort? Start at aidelly.ai.
Compare social scheduling tools
Evaluating software for your content workflow? Use our buyer guides and comparisons to compare scheduling, approvals, analytics, and AI workflow fit.